My Thoughts on a Recession

What’s up legends!

After a fairly tragic week last week thanks to Jerome Powells speech at the Jackson Hole Symposium, I thought I’d take a moment to share my thoughts on a potential recession. As couple of weeks ago I posted this message on my Facebook, which was met with mixed comments:

SPX Recession 2007

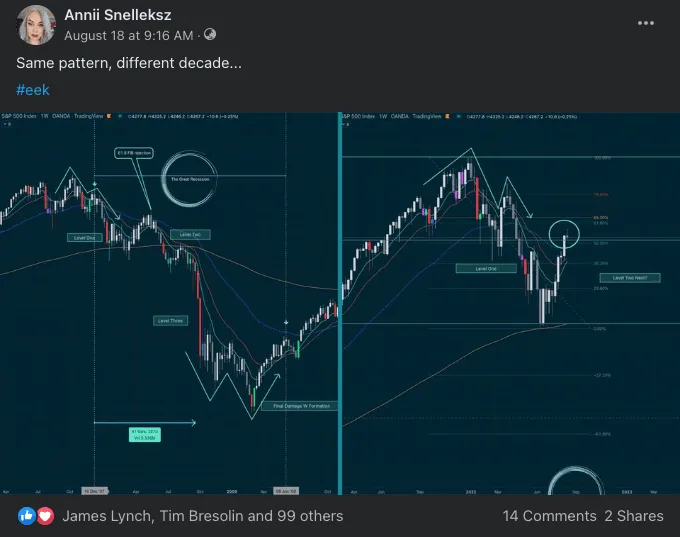
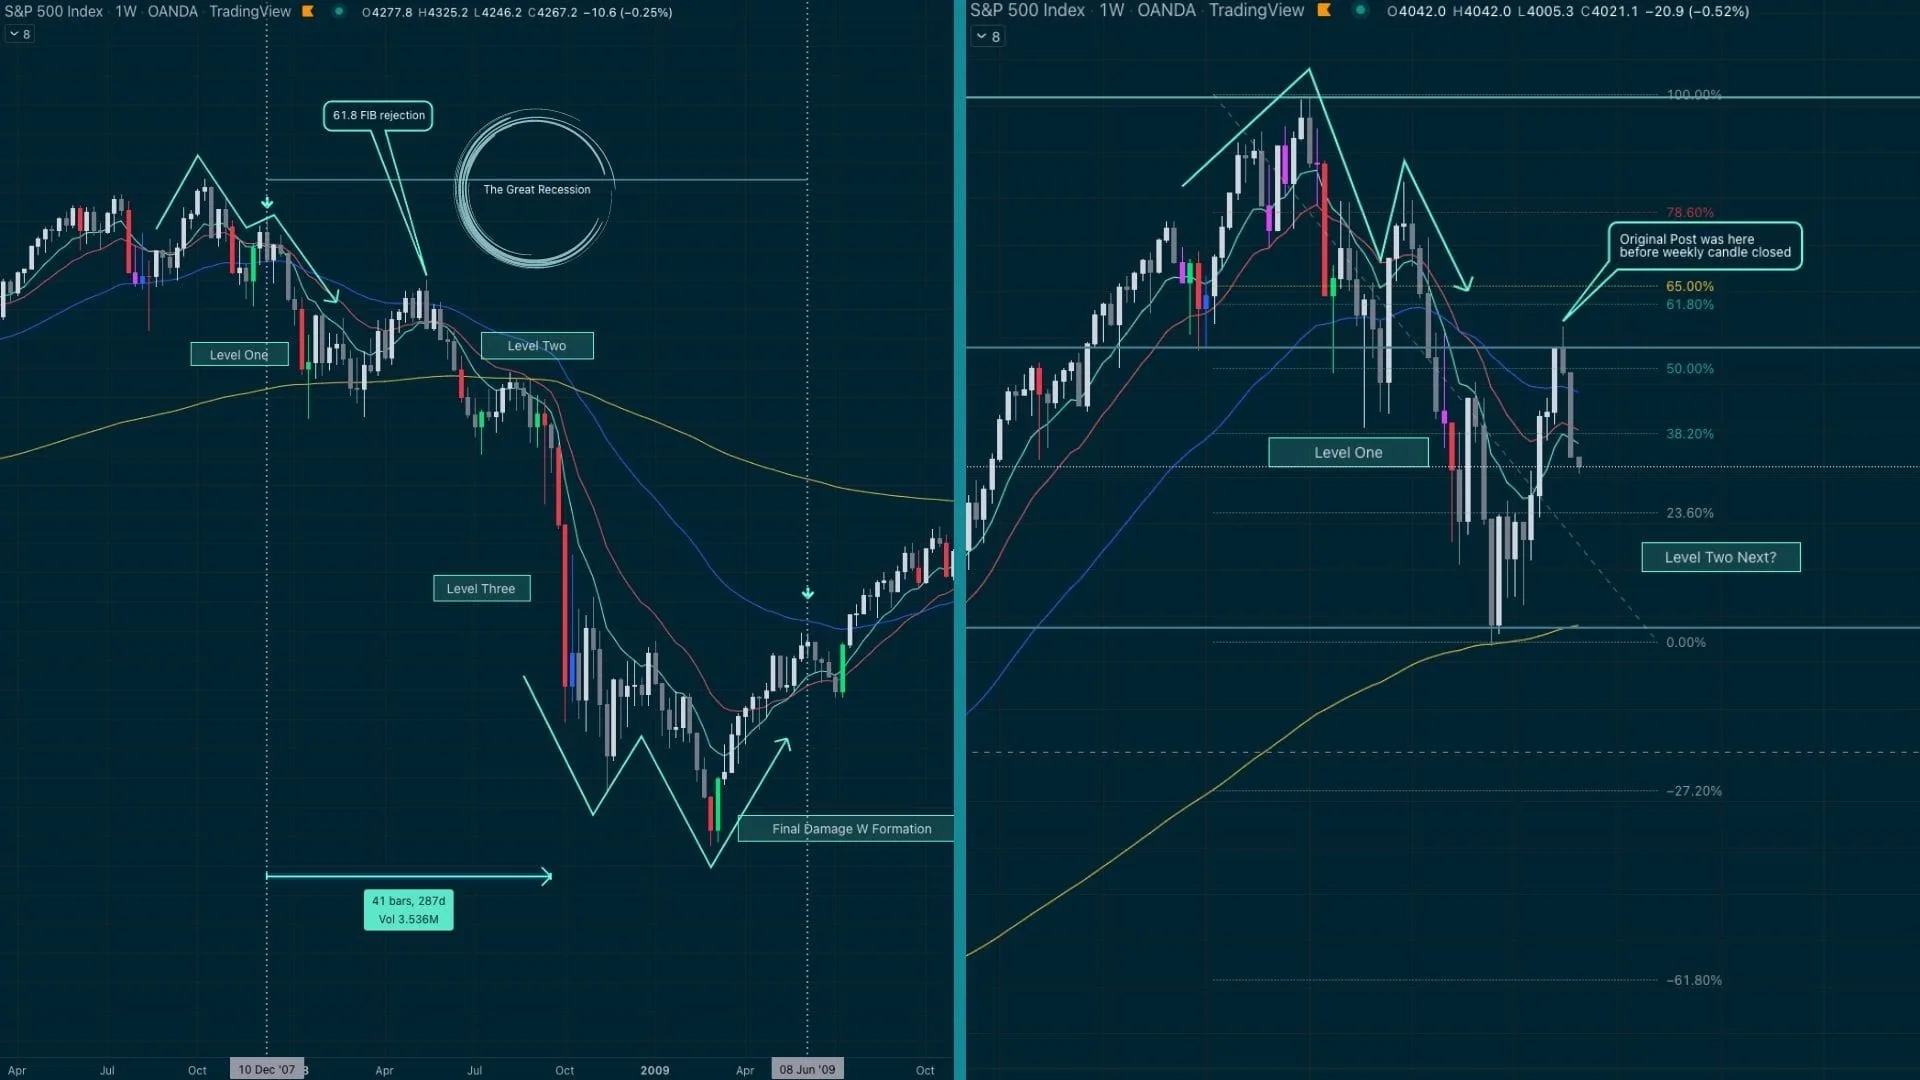
Since that post on August 18th, we know know that SPX has rejected that area that was circled on the right image, just as it did during ‘The Great Recession’ between 2007-2009. If we’re to follow the rules of the market maker method, we would now expect drop level two, meaning more downside to come, on a macro level.

Here is the SPX currently in comparison with the Great Recession of 2007-2009. The image on the left is the great recession; the image on the right is current price action.

SPX Recession 2

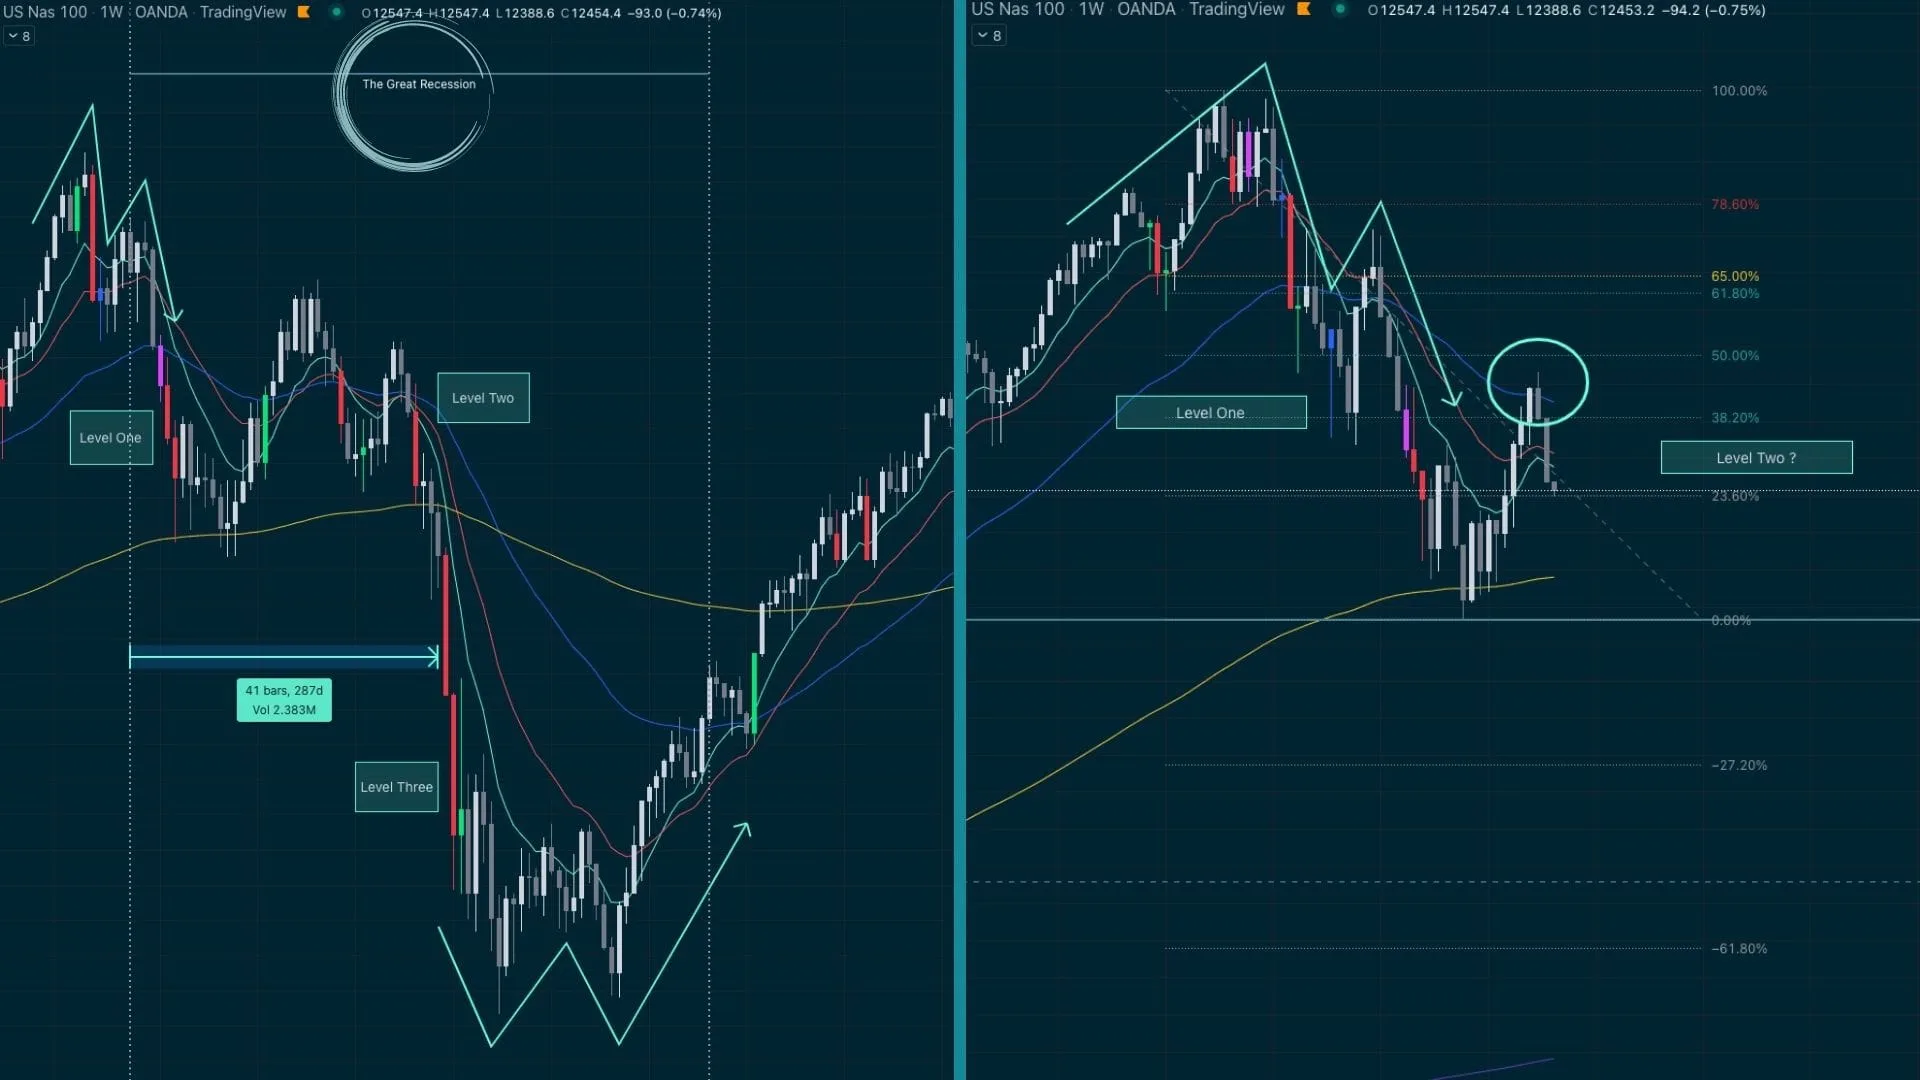
Interestingly, NASDAQ is repeating almost the exact same thing. Once again, the image on the left is the great recession and the image on the right is current price action.

NASDAQ Recession 1

But here’s the thing…. we know that history doesn’t repeat, it rhymes. If history were to repeat, that would mean level three will be the most dramatic of all & considering we are only just entering level two now, we have to start to ask ourselves, how much worse can it really get… I mean, we’ve already had a pandemic, we’ve had war, money printing, a new president, food shortages, inflation, we know there’s more interest rate rises coming… The only thing left is a housing market crash & with more demand than supply in most liveable cities, this may not actually be a given. We know what to be prepared for because thanks to this magical thing called the ‘internet’ people are much more informed these days than they were in past recessions. So whilst we are currently mirroring the 2007-2009 recession when looking at charts alone, that’s not a guarantee that our level three yet to come will be as bad as 2009.

There’s some key difference I see between then and now. Let’s go through them.

Recession Announcement

So far, a recession has not actually been confirmed by the FED. We have seen the criteria for a recession change in wikipedia and we’ve seen politicians dance around what actually qualifies a recession. However, when looking at 2007 recession, the drop level one actually came after the confirmation of a recession. Notice also, that the M formed before the recession was announced…. I wonder if that could be ‘by design’….

Also, now is a good time to shamelessly plug the Trade by Design Method. If you want to be able to read charts this way, then come and join us at Trade Travel Chill where you can get access to my complete ‘Trade by Design’ method and the ‘Invest by Design’ method also. Be sure to check out this video if you want to know more.

Therefore, considering we now have a drop one without a confirmation of a recession, that begs the question… is this move an assumption by retail traders derisking in anticipation of what they believe should happen as opposed to trading what is actually happening…

Inflation

As I mentioned earlier, Jerome Powell (Federal Reserve Chairman) spoke at the opening of the Jackson Hole Symposium and during this speech he spoke of more pain to come as a result of trying to fight inflation, which could lead to the economy crashing and the possibility of entering a recession. July’s CPI came in at 8.5% and the PCE came in at 6.8% with economists expecting a fairly tame reading for August (this will be released September 13th).

Unemployment

For many months now the Unemployment Rate has been used by the FED as their reasoning as to why we are not officially in a recession right now. They say we have plenty of jobs available and for that reason, things are still ok. That doesn’t mean this won’t change & that a recession won’t happen though. But could this be a sign that if one does happen, it may not be as dramatic as the Great Recession was for the markets…

Crypto Market

Whether or not crypto has seen the bottom already or not is a really hard call to make. If we weren’t facing a financial crisis, it would be easier to trust past data to project into the future. Previously bitcoin had never broken below a previous cycle’s ATH in its next bear market. Some say that in this cycle it has, others say it’s still valid. It depends how you mark the 2017 ATH. If marking higher timeframe candle closes, then the rule still stands. If including wicks, it’s been broken. So let’s turn to a few other metrics I turn to that help me pick the cycle bottoms and tops and see what we can conclude from these.

1. Weekly and Monthly RSI

Monthly – using the BLX chart which has the most data available for bitcoin, we can see that in all previous bear markets, the bottom was put in when the RSI reached between 41-45. It also stayed there for many months before a new trend began, suggesting there is no rush to “buy the bottom” and that if this in fact the bottom now, or there’s more downside to come, it’s likely we’ll revisit the lows a number of times. This will give us plenty of opportunity to buy in. A warning about this RSI however, when bitcoin recently dropped to 17-18k, this RSI put in a read of 41.2 which is the lowest it’s ever been on a monthly chart.

Weekly RSI

Weekly – This RSI has two major levels that are both significant when talking about cycle bottoms. 27.4 & 33.7 have acted as RSI supports numerous times in the past. Again, the recent drop took us slightly below the 27.4 for the first time in BTC history however, so far we have returned back above it and are currently hovering between both levels. If the RSI were to create a weekly timeframe bullish divergence, that would be a positive signal for me & something worth watching out for.

Weekly RSI

2. MVRV

The Market Value to Realized Value (MVRV) is the ratio between market cap and realised cap. It gives an indication of when the traded price is below a “fair value”. From this chart we can see that anytime the MVRV has dropped below the number 1 has signalled a cycle bottom. Again be aware though that the MVRV can spend quite sometime below 1 before a trend changes so it doesn’t mean the absolute bottom is in, possibly just close enough.

MVRV

3. Hash Ribbons

This indicator on TradingView measures the miners capitulation period. According to the creators of the Hash Ribbon, “the best buy signals occur on Hash Rate “recovery”, and when price momentum is also positive”. Recently this indicator flashed a buy signal on the daily timeframe after bitcoin hit a low and then started a short term recovery which had us seeing 25k bitcoin again. One thing to note however is that we have not seen a buy signal on this indicator on the weekly timeframe yet and considering this article is about long term investing, that’s where we would want to see the buy signal next.

Monthly RSI

Conclusion

The information above are a few factors I personally consider when long term investing. There is a lot more which shared inside The Capital Club, a TTC membership which teaches you all you need to know about trading and investing in the crypto market, including access to my own crypto investments & when I buy and sell. You can read more about that and join us here.

Most of these charts are signalling that now is a good time to start slowly investing in cryptocurrency for the long term. However, I must caution that when it comes to crypto, that this asset class has never seen a recession before and this period right now, is crypto’s biggest test to date. All of these metrics could fail so investing based off these is done at your own risk. It’s for this reason that I personally am spreading out my capital and buying in slowly over time, rather than relying on this information as a buy signal.

Important Notice: The information in this post is general and is designed to be educational only. We do not seek to provide you with personal advice nor make any personal recommendations of any kind. You should not rely on any information provided in this post as such. Whilst be do believe that the information provided in this post is accurate and reliable, no warranty is given to this effect. Cryptocurrencies are a high risk and complex investment and you must carefully undertake your own research and consider your own financial situation and personal circumstances before investing in them. Where and if appropriate, you should also seek professional financial advice.

Recent Posts

Trade Travel Chill

Creating freedom through Crypto as a Community

5 Responses

  1. @Anni,
    You do the strangest things on a holiday, we usually lounge on beaches and get spoiled rotten, you crank out little diamonds like this… 😂👌. Awesome article though, and very interesting take on the macro vs micro. I am starting to “bottom-feed” but am still expecting considerable more downside for a while as i am fairly sure the housing market is going to get hit pretty bad, especially in US & EU with EU having a dramatic energy-drama looming this winter. But, i agree, i do not think we have another 50-70% drop to go. Thx for these insights, it’s astonishing how much value you create and very happy to be part of the TTC capital club Fam. ❤️👌